
The Data
Working with Garmin Data
The data being used for this time prediction analysis is collected from my Garmin watch during my training for the Chicago Marathon in 2019. I chose to use my own data so I can accurately report if the predicted time matched my actual Chicago marathon time, as well as examine other factors that could have influenced mileage times. The dataset contains 121 logged activities, and 28 descriptive columns from May 3rd to October 20th in 2019.
Analysis
For the analysis I will be working in a Jupyter notebook and using DataFrames and grouping operations in Pandas to examine performance across the training time frame. For visualizations I incorporated the seaborn feature of Matplotlib for comparisons, as well as heatmaps and K-means clustering

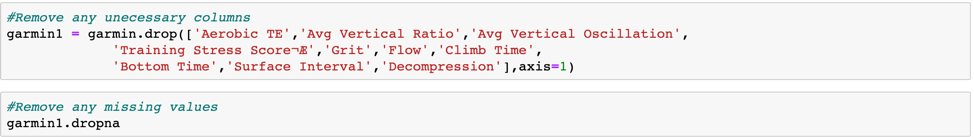
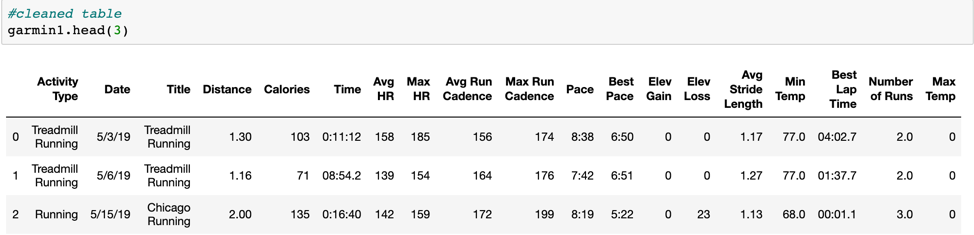
Data Cleaning
As you can see above, the data imported from my Garmin had several columns that would not be used. To make it easier to examine the table and pull information for further analysis, I removed several columns as well as cleaned out any null data. I additionally changed some of the variable types in the Dataframe so I can use the information to gather valuable knowledge. For example, date needed to be converted to datetime if I wanted to perform a time series analysis on the information.

Time Series - Indexing

